
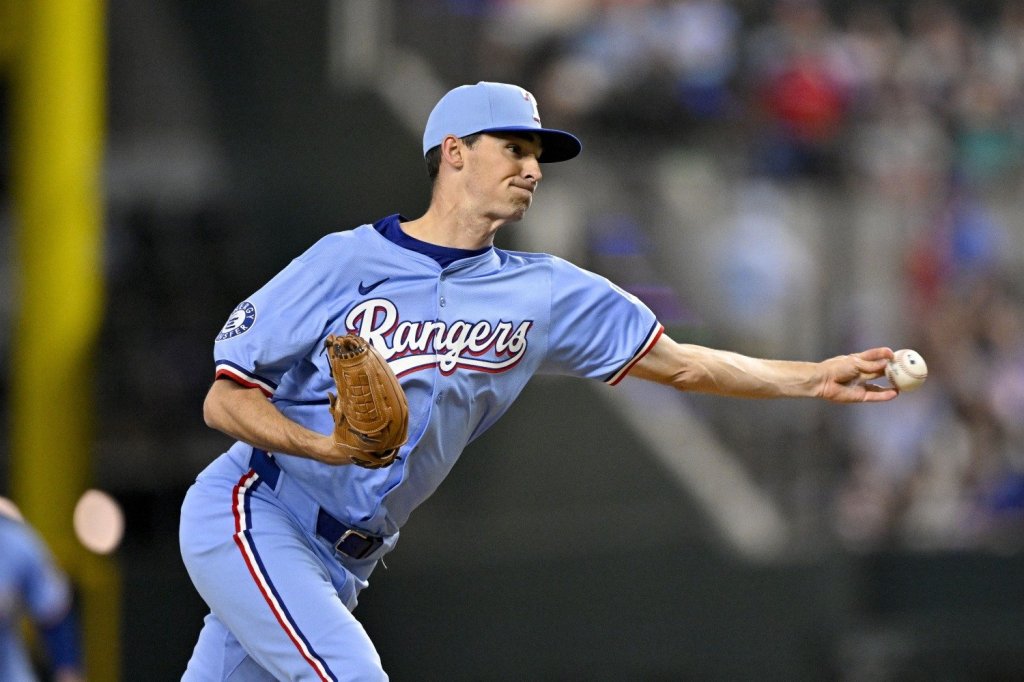
Left-handed reliever Hoby Milner has signed a one-year contract with the Chicago Cubs worth $3.75 million guaranteed. Milner, a 34 year old Texas native, has one of the most unique arm slots in all of baseball and last pitched for the Texas Rangers in 2025.
Contract Details
Hoby Milner signed his one-year contract which guarantees him $3.75 million in 2026. Yet again, the Cubs’ front office continues with their pattern of handing out one-year deals to fortify their bullpen; a strategy that worked well for the team in 2025. Milner’s contract reflects his WAR (Wins Above Replacement) value from last year. Generally, relief pitchers can expect to earn anywhere between $4-8 million per WAR. FanGraphs gave Milner an fWAR of 1.0, while BaseballReference wasn’t nearly as kind, giving him a whopping -0.6 bWAR.
Under normal circumstances, the difference in WAR values could generally be attributed to Milner playing in front of a poor defense: but the Rangers were collectively one of the better fielding teams in the American League last season. While the difference is somewhat head scratching, the differences in WAR could potentially be attributed to Milner’s 52.7% ground ball rate, and the fact that he only gave up 5 home runs in 70 innings pitched, which gets rewarded more in FanGraphs’ WAR metric. His elevated BABIP (Batting Average on Balls in Play) may have also resulted in FanGraphs calculations being slightly more lenient.
As always, the main question I would like to pose is whether Milner is worth his contract and what we can expect out of his performance in 2026. Let’s dive into the numbers.
2025 Performance
Hoby Milner had a somewhat underwhelming 2025 season. He threw the most amount of innings in his 9 year career (70.1 IP), and we understand that a pitcher’s best trait can oftentimes be his availability. However, if a pitcher isn’t effective in getting outs and preventing runs, do we really care whether he’s available or not? Let’s compare Milner to his peers across a number of categories.
First and foremost, Hoby Milner was in the 91st percentile in Ground Ball Percentage (53.8%). This bodes very well for a Cubs team that has Dansby Swanson (2x Gold Glove winner) and Nico Hoerner (2025 Gold Glove Winner) playing up the middle. Complemented by two above average corner infielders in Michael Busch and Matt Shaw, Milner can work to his strengths here. He was also in the 79th percentile in Hard-Hit Percentage, proving that he has the ability to induce weak contact which again bodes well for an excellent fielding team like the Cubs. He is also above league average in terms of his Walk Rate and Average Exit Velocity; all good signs.
However, that is not to say that he comes to the North Side without any weaknesses. For one, his Fastball Velocity is in the bottom one percentile. Milner doesn’t come close to lighting up the radar gun in the same way that many of his peers do, but he doesn’t necessarily need to (more on that later). His fastball velocity will bring Cubs fans back to memories of Kyle “The Professor” Hendricks; hopefully the 2016 version. Milner’s Chase Percentage is at the bottom 10th percentile, his Whiff Percentage is yet again bottom one percentile, and his Strikeout Percentage sits at the 28th percentile. All of this goes to show that Hoby Milner is not a strikeout guy that has bat-missing stuff. He gets by on inducing weak contact and ground balls, relying on the defense behind him to make plays. This, by no means, indicates that he’s a bad pitcher; quite the contrary. Pitching in front of a solid Cubs defense has the potential to bring out the best in Milner, and he may feel far more comfortable pitching to his strengths than in previous years.
Let’s look at some other statistics. In 2025, Milner posted a FIP (Fielding Independent Pitching) of 3.39 and his FIP- sat at 80. This statistic is intended to remove the defense from the equation and measure a pitcher’s true ability based on the outcomes that he can control: strikeouts, walks, hit batters, and home runs. These numbers indicate that Milner is 20% better than league average. While he will certainly benefit from a strong defense behind him, he doesn’t necessarily need it because he limits the home runs and walks that he gives up. His ERA of 3.84 is slightly higher than his FIP, which would normally indicate that he was getting a bit unlucky in the 2025 season. This is also evidenced by his xERA being about 10 points lower than his actual ERA. In essence, Milner should have been slightly better than he was last season.
One statistic that seems to correlate quite well with overall performance is ERA-. ERA- is a statistic that accounts for park factors and league average, and centers on a scale of 100 much like OPS+; in this case, lower is better. Milner’s ERA- sat at 95 for last season, indicating he was just a little bit better than league average in terms of earned runs allowed.
Pitch Repertoire
This is where things get really interesting, and why Milner has been able to stick around for so long with a far-below average fastball. Everyone who has watched Hoby Milner pitch understands exactly what I’m talking about. His arm angle sits at an incredible -6 degrees, throwing the ball from a sidearm position that keeps hitters off balance and makes the baseball move in funky ways. In the last five years, only one other left-handed pitcher has averaged a lower arm angle than Milner (minimum 100 pitches thrown since 2021). This, by far, is what has enticed MLB teams to take a chance on him.
Let’s take a look at Milner’s four-seam fastball and sinker first. His fastball has less rise than average, but breaks more to the arm side than most major league pitchers. In terms of the overall induced movement, Milner’s fastball more closely resembles an average sinker for most pitchers. The same story can be seen in his sinker, which averages nearly 18 inches of induced movement towards his arm side and has about 6 more inches of drop than his fastball does. He uses his sinker far more often than his fastball (33% usage vs 15% usage), but this may be due to the matchups he faces. His fastball is predominantly used solely against right-handed batters, while he tends to trust his sinker against all batters.
Milner also offers two change of pace pitches; a changeup and a sweeper. His changeup has about 12 more inches of drop than MLB average, but usually ends up in about the same place his sinker does. Combine this with the fact that the difference in speed between his fastball & changeup is less than MLB average, he can get himself into situations where hitters continuously foul pitches off. At a 17% usage rate, his changeup gets thrown almost exclusively to right-handed hitters. His sweeper sits around MLB average in terms of induced movement, but with his funky arm slot it can certainly throw hitters off balance. He throws his sweeper 35% of the time, even more than his sinker, and it’s easy to see why. Utilizing two pitches that break opposite directions from a funky arm slot can be incredibly overwhelming to opposing batters.
According to the numbers, Milner’s best pitch is actually his under utilized fastball (.154 BA, .256 SLG, .206 wOBA). Although, it does get utilized nearly two times less than his sinker, so there could certainly be some unintended noise caused by the fact that hitters don’t see it nearly as often. Although he only averages 88 mph, his fastball actually has the highest whiff percentage of any pitch in his arsenal (21.3%). His worst pitch is his changeup (.296 BA, a whopping .537 SLG, .369 wOBA), which he heavily relies on against right-handed batters. Again, the fact that he only uses his changeup in tougher matchups against right-handed batters may add some noise to the sample and explain why the pitch gets hit as often as it does. His sinker, most likely due to usage rate, is also not quite as formidable as one would like (.288 BA, .404 SLG, .329 wOBA). It’s interesting to note that his sinker and changeup usually end up in almost the same location, and have only a 6 mph difference in speed. Perhaps if he could induce slightly more movement on his changeup or increase the difference in speed, these numbers would drop.
In terms of platoon pitch usage, Milner tends to only use his sinker/sweeper combination against left-handed hitters. In tougher matchups against right-handed batters, he utilizes all four pitches at his disposal. While I’m sure there is a very good reason for these splits, I really would like to see Milner utilize his fastball more often, as it has proven to be his best pitch over the last two years, even if it averages a higher exit velocity than his other pitches. If he can locate it well and allow it to play off of his sinker, I think it would prevent left-handed hitters from sitting on a sinker/sweeper combination.
2026 Outlook
When projecting future performance for pitchers, I like to look at a few different things. First and foremost, we’ll start with Milner’s expected statistics from 2025. We’ll also take a look at projection systems MARCEL and Steamer, and I previously mentioned how K-BB% can be a good indicator of future performance.
Milner’s xERA and xBA sat above league average (61st and 58th percentiles, respectively). Both of these numbers being lower than his actual stats indicate that he is due to improve, even if only a slight improvement. While I tend to not put too much emphasis on xFIP, it is higher than his actual FIP. This shows that Milner may be getting somewhat lucky; either due to a good infield or limiting the amount of home runs he gives up. I’m of the belief that home runs are thrown, not hit, and so I won’t focus too much on the difference here. There are also a few Statcast metrics showing that Milner might be getting a bit lucky.
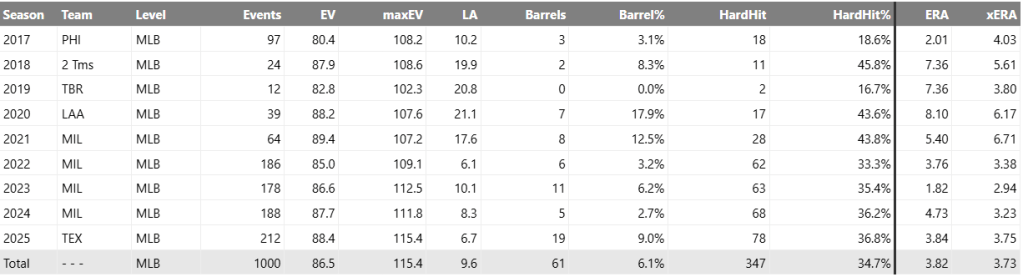
Here we can see a general trend in the MLB; as Exit Velocity, Launch Angle, Barrel%, and HardHit% rise, so does ERA. Over the last three seasons, Milner’s allowed EV, maxEV, and HardHit% have all risen. We can see that in 2024 he got a bit unlucky, as his xERA is lower than is actual ERA by 1.5 which is quite mindboggling. While this graph doesn’t tell us why exactly that was, we can speculate that much of it may have been due to poor defense. The point I’m trying to make is that Milner’s numbers have been, in general, trending in the wrong direction over the last three seasons. He was able to keep his Launch Angle down last season, and I believe this is what helped him to keep his ERA in check even with a Barrel% three times higher than in 2024.
Another great indicator of future performance is K-BB%; quite simply, it is strikeout percentage minus walk percentage. Milner’s K-BB% for last season was 12.6%, which is a bit worrying. From 2022-2024, Milner’s K-BB% was around 18% and in 2021 he was close to the top of the league with a 27% K-BB percentage. In essence, his numbers have been trending down and his 2025 season was his worst in the last five years. While the Cubs pitching coaches have been known to revitalize pitchers who had poor performances in previous seasons, this trend is worrisome for 2026. This trend can be seen in Ryan Pressly’s stats over the last few years as well, although not to the same degree. From 2021-2025, here are Pressly’s K-BB% respectively: 27.2%, 28.6%, 21.6%, 16.4%, and 6.0% for 2025. Cubs fans are all too familiar with the downfall of Ryan Pressly, but looking solely at his K-BB% it is easy to see why the Houston Astros chose to move on from him when they did; the writing was on the wall. While the Cubs pitching coaches have been known to revitalize pitchers who had poor performances in previous seasons, this trend is worrisome for Milner in 2026.
FanGraph’s Steamer projection system seems to agree with the sentiment that Milner is trending in the wrong direction, as the system projects most of Milner’s statistics to reflect his 2025 performance or get slightly worse. In particular, his K-BB% is projected at 12.2%, his HR/9 is over 1.00, his projected FIP sits at 3.99, and his GB% is expected to drop by nearly 5%. The MARCEL projections taken from BaseballReference show some mixed signals, but treat Milner a bit more kindly. His ERA is projected to be just slightly over 4.00, although his K/BB rate is expected to be better than it was in 2025. This may be due to the fact that MARCEL’s hit, walk, and strikeout projections are kinder than Steamer’s. While no projection system is perfect, we can estimate that Hoby Milner’s 2026 performance is likely to match his 2025 performance. However, I do expect Milner to benefit from pitching in front of a great Cubs’ defense, and by no means do I expect him to be a bad pitcher; I would project him to sit right around MLB average.
Conclusion
The question posed at the beginning of this article was two pronged; what can we expect out of Hoby Milner’s 2026 performance, and is he worth his $3.75 million contract? We touched on his anticipated 2026 performance above, and I believe that he is likely to replicate his performance from 2025 while also being aided by a good defense even more than he was in Arlington last season. His projection to sit right around MLB average seems to fit his 2026 contract quite well.
In general, I find that the $/WAR for reliever contracts sits anywhere between $4-8 million, depending on age and a few other factors. While Steamer projects his fWAR to sit around 0.2, I find this to be a bit harsh. If we can anticipate Milner’s performance to replicate his 2025 season, where he earned an fWAR of 1.0, then his contract sits just shy of my anticipated $/WAR value. This leads me to believe that Milner is certainly worth his contract, particularly given the makeup of the Chicago Cubs’ bullpen so far.
With Caleb Thielbar also under contract, the Cubs have two left handed relievers that attack hitters from very different angles. Thielbar has one of the highest arm angles for left-handed relievers, while Milner has the lowest. This will certainly play a role in giving hitters different looks over the course of the season, and is one of the many reasons I like this contract for both Milner and the Cubs. They don’t need Milner to be a shutdown reliever; his contract reflects that fact. If he can be an average reliever that is aided by a good defense, then I believe this contract is a win for the Cubs.
All statistics and metrics were pulled from FanGraphs, Baseball Reference, and Baseball Savant unless otherwise noted

Leave a comment